

The American definition of poverty is a 1963 math problem we’ve forgotten to solve.
The United States has been using the same quaint benchmark to track the poverty rate for the better part of seven decades. Put simply, the methodology for calculating the poverty line has long been broken.
We can’t set out to curb and eventually eradicate poverty if we can’t even effectively define and measure it. We are long past due for improved methodology that accounts for the many nuances of what it costs to merely exist.
Meet Mollie Orshansky
The United States didn’t have a federal standard for measuring poverty until the 1960s. Mollie Orshansky, an economist with the Social Security Administration, was tasked with creating an official measure.
Estimating that Americans spent about a third of their income on food, Orshansky came up with a simple equation: take the dollar value of the Department of Agriculture’s bargain food plan and multiply it by three. If a family’s total pre-tax income was beneath that benchmark, it couldn’t afford basic necessities and would be considered impoverished.
The federal government began using Orshansky’s Official Poverty Measure (OPM) as its statistical definition of poverty in 1969. Some 67 years later, that’s still the line federal agencies use to determine eligibility for programs like SNAP and Medicaid.
A mathematical relic
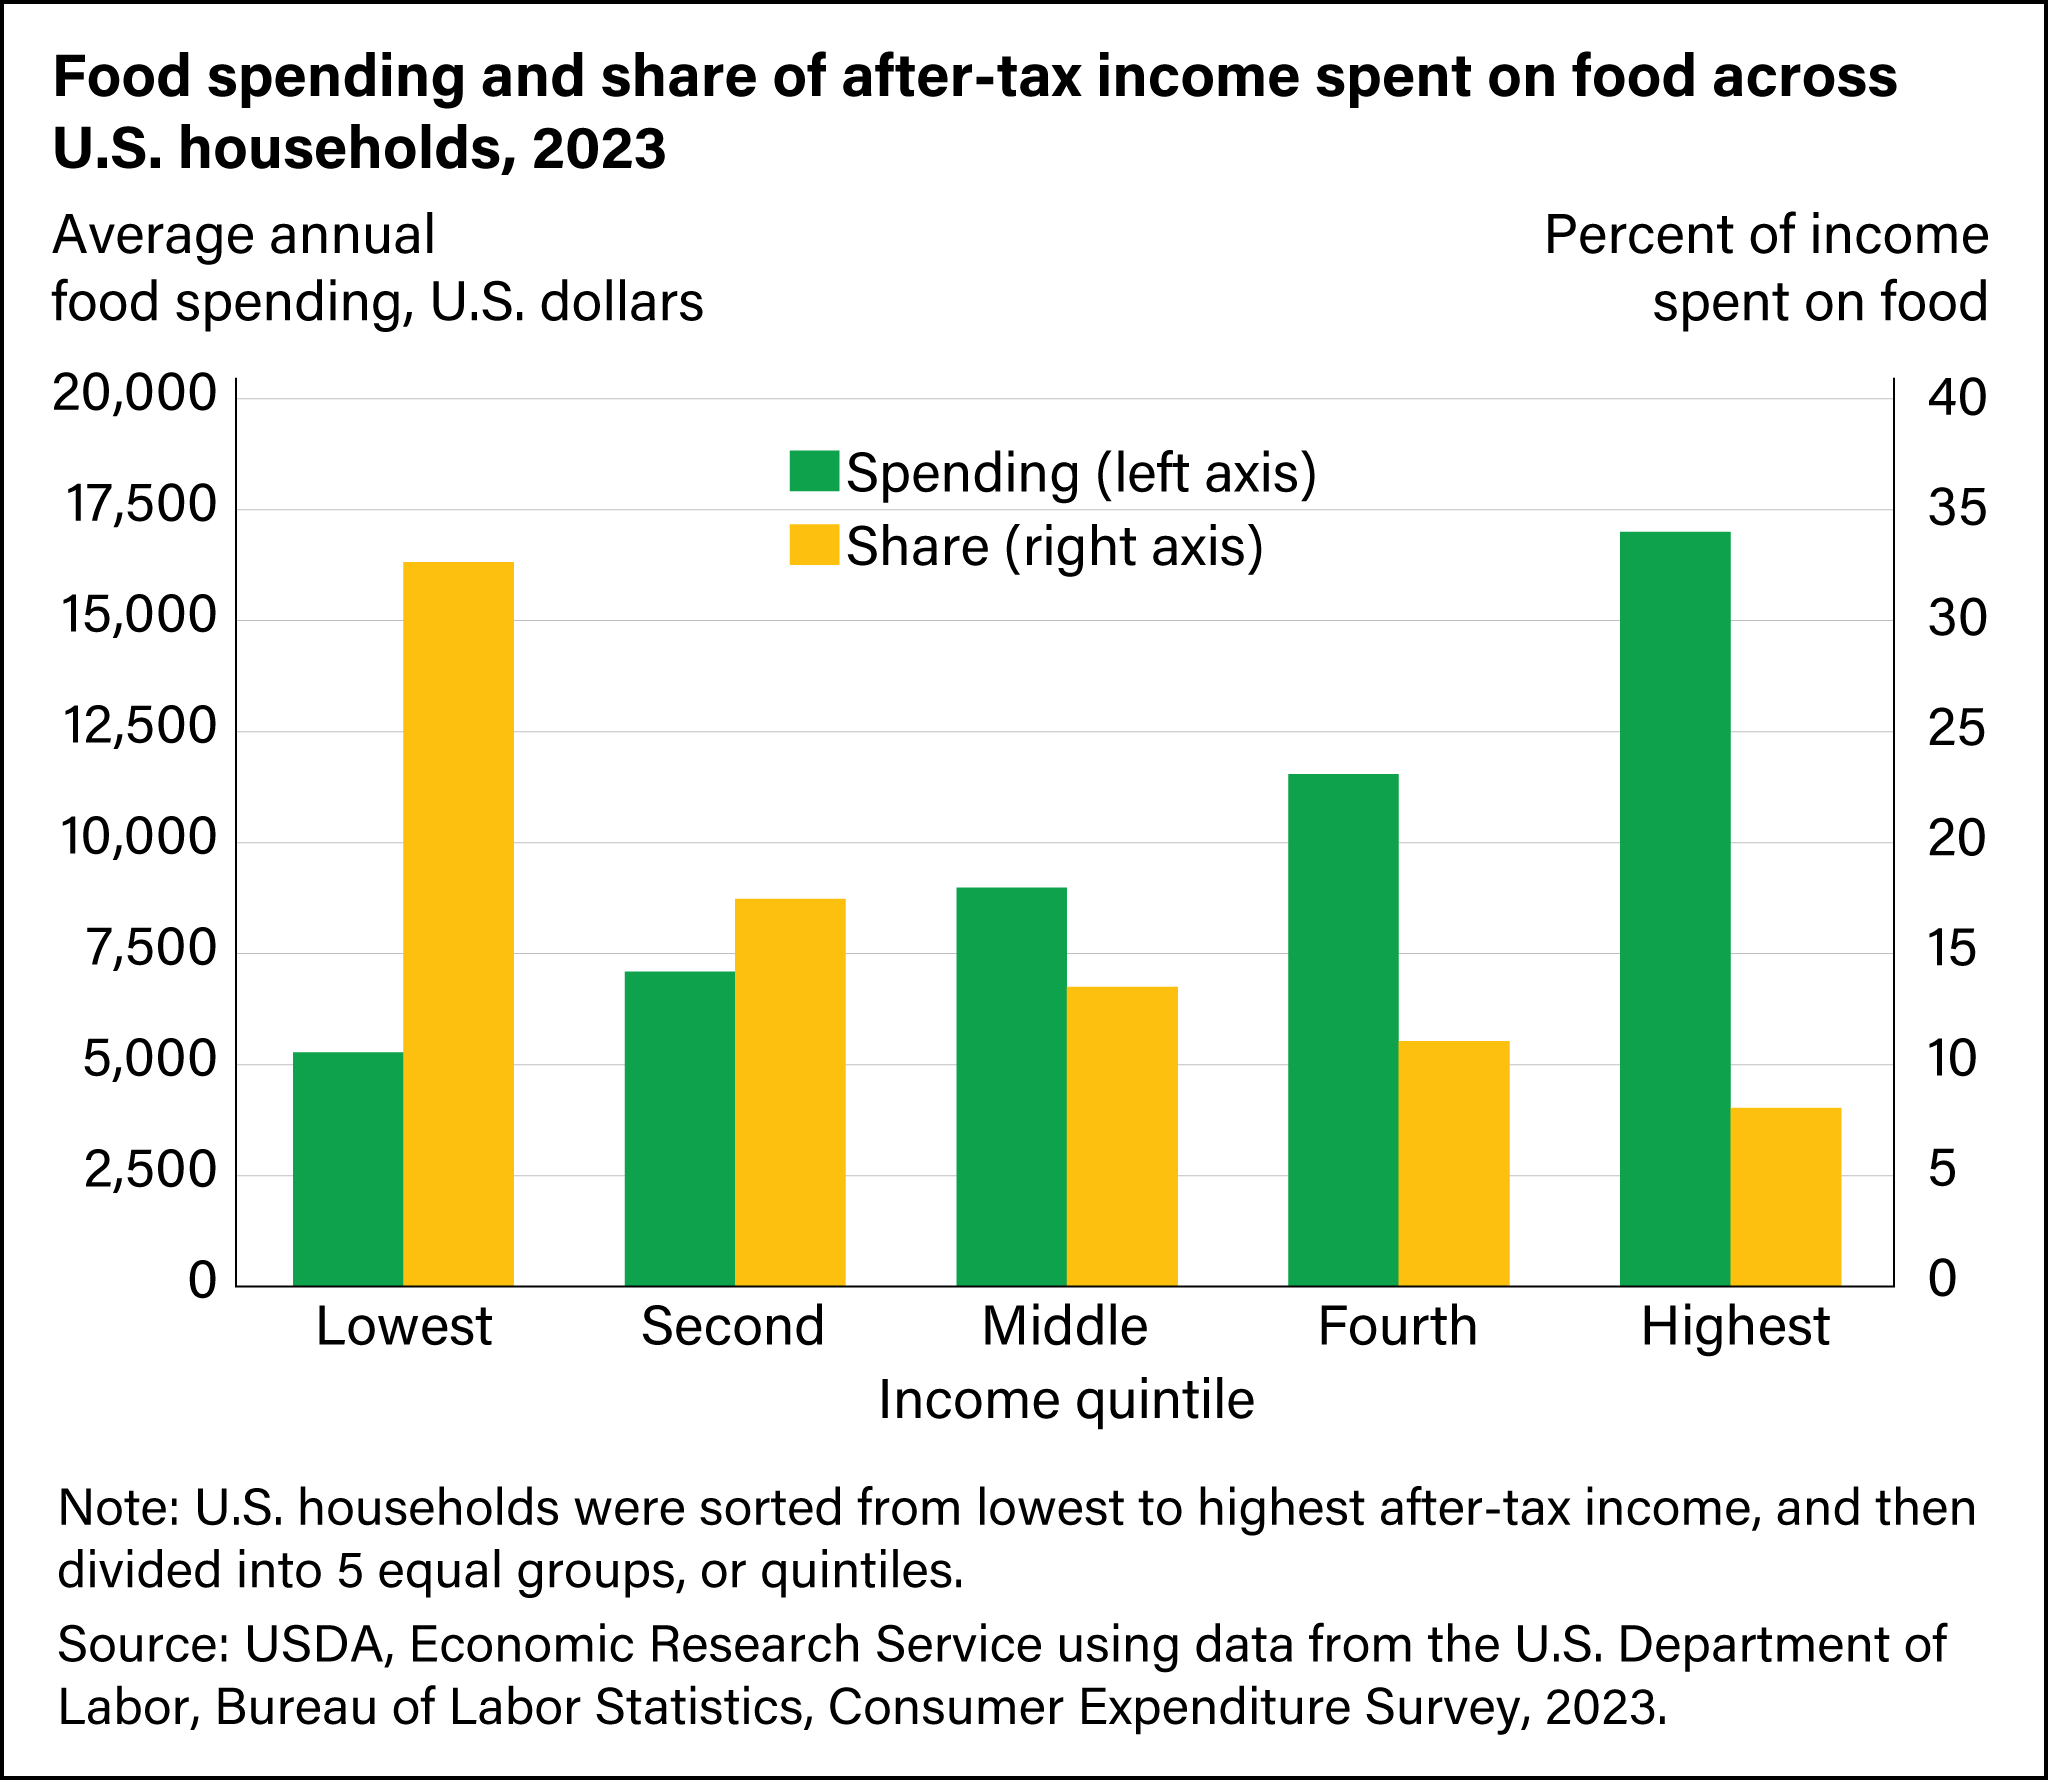
Today, the average household spends much less than a third of its income on food. However, Orshansky’s one-third rule of thumb is actually still relevant in this context. Households in the lowest income quintile spend about 32 percent of their after-tax funds on food. It’s worth noting here that Orshansky’s OPM uses pre-tax income.
Engel’s law — the idea that food expenditures as a percentage of budget decrease as incomes increase — is what drives down that overall average.
The greatest limitation on Orshansky’s methodology is that it doesn’t account for the explosion in housing and healthcare costs over the past two generations. It assumes you can’t be poor if you can afford to eat, even though many millions of people are an emergency medical bill away from eviction.
In the 1960s, a house cost a little more than two years worth of a family’s income. That price-to-income ratio today has ballooned to four or five years of income. Housing prices, adjusted for inflation, have grown by more than 120 percent since 1960. Rents are up more than 70 percent in that time, too. Median incomes, on the other hand, have increased by a relatively meager 29 percent.
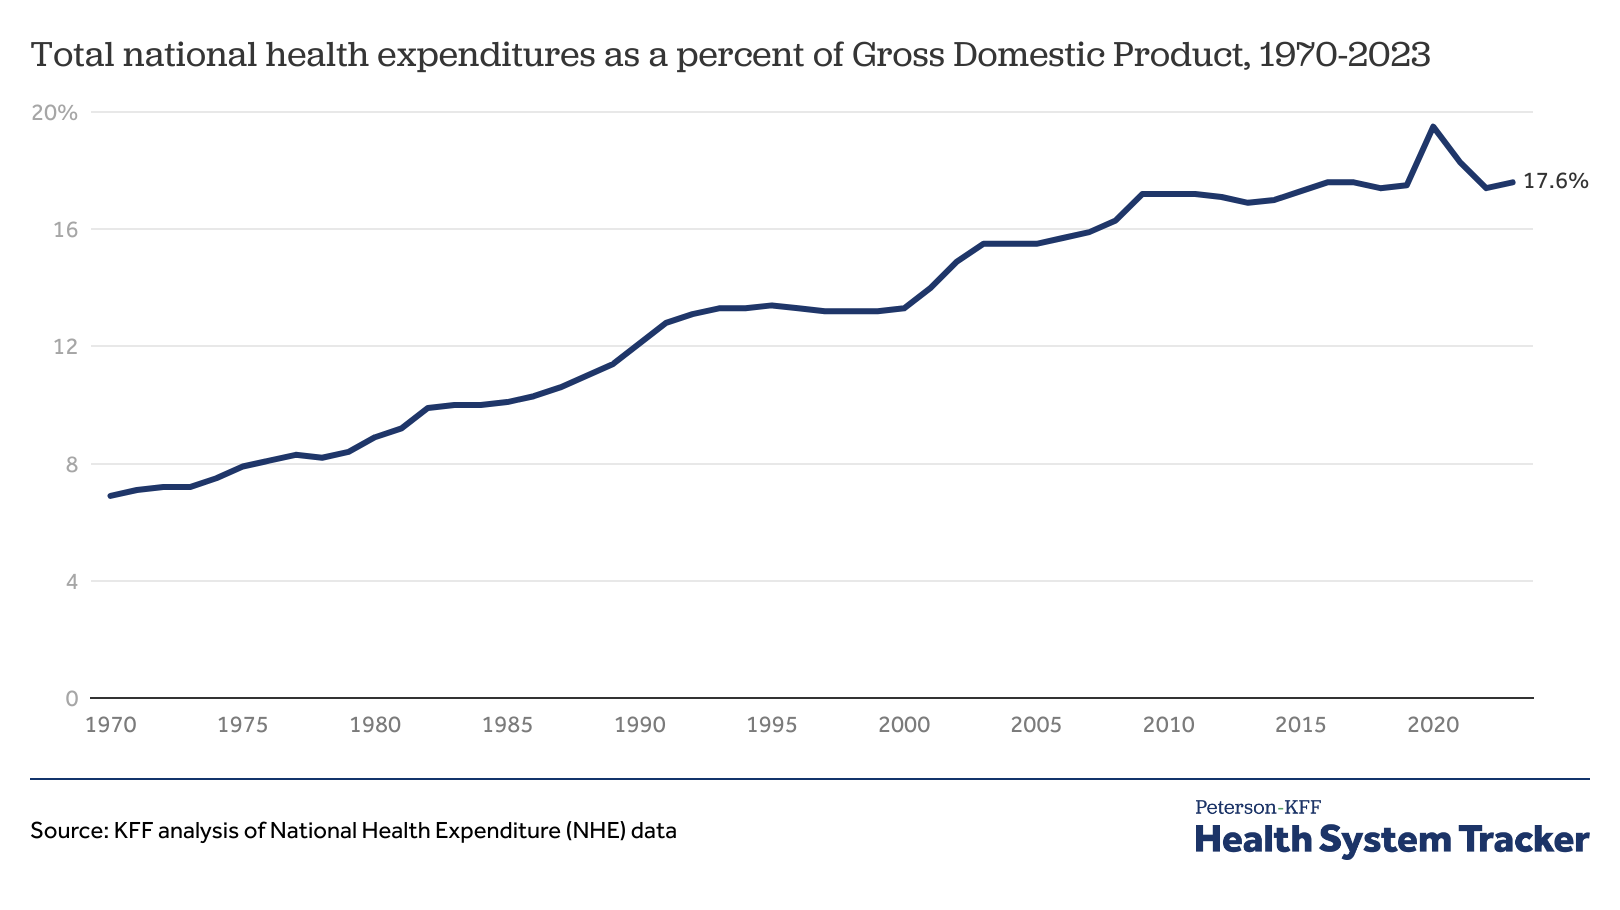
Family budget allocations to healthcare have also exploded over this period. Such expenditures used to be a minor line item on the household budget a generation or two ago. Now, according to a Kaiser Family Foundation analysis of National Health Expenditure data, it’s consuming nearly a fifth of the average family budget.
To the extent it was ever an effective method, Orshansky’s simplistic equation for deducing the poverty line has long been rendered ineffective. Why else would so many programs calculate eligibility by using 150 or even 200 percent of the poverty level?
Finding and helping the invisible poor
We’re using a 1960s measure to measure poverty in 2026 — it’s no wonder that there’s an invisible working poor struggling to get from one day to the next but locked out of support programs that could help them get a leg up.
A pragmatic — and, honestly, entirely easy — solution has been in front of policymakers for more than a decade. The Supplemental Poverty Measure (SPM) was created to try to address limitations of modern-day use of Orshansky’s OPM. The SPM accounts for out-of-pocket spending on food, clothing, shelter and utilities by taking the 33rd percentile of this expenditure group and adding 20 percent to it. It also adjusts for variables such as location and family makeup.
The difference between the OPM and SPM rates in 2024 was about 7.8 million people. Among them are single parents getting squeezed by climbing childcare costs and grandparents on fixed incomes rationing medications.
Those are all people we can’t support if we can’t even measure them.
So, it’s simple: move to using the SPM to determine eligibility for programs like SNAP and Medicaid. This is a tool that is already being calculated every year, making it a ready-made replacement we’re choosing to ignore.
To celebrate the 100-subscriber (now 200!) milestone and help us hit the ground running in February, I am offering a 20% discount on annual subscriptions until the end of the month. Your support at this stage directly funds insights and analysis that will remain free for everyone.
Thank you for reading. If this piece resonated with you, the best way to support my work is by sharing it. Every share helps grow this community of advocates committed to ending hunger and food insecurity in our communities.